Alerts
An Alert lets you check your data in order to verify if the value is either above or below a specified threshold, respectively high and low threshold.
Important
Alerts will be decommissioned this year, in favor of alarms, which are more efficient and offer greater functionality.
Learn more about alarms.
Currently, an alert can only be configured on a single variable. To simplify the selection of the variable, you have to select the site and the source in which the variable is configured.
Datahub supports 3 types of alerts:
- Raw: in this mode, Datahub will validate the value of every datapoint against the threshold.
- Rolling: in this mode, for each datapoint, Datahub will validate the aggregated value of a specified period preceding and including the datapoint.
- Scheduled: in this mode, Datahub will validate the aggregated value of a specified period at a specified time.
In order to further explain the implementation and the expected results we will use the following drawing:
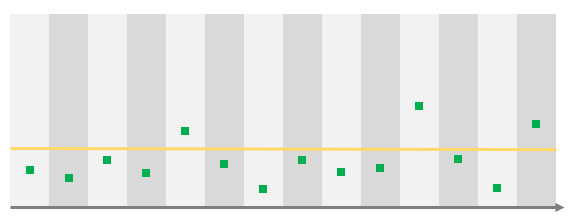
It represents a simple timeline on which:
- The vertical gray bars represent a unit of time. In the following cases, we will use hours.
- The yellow line represent the define threshold. In the following cases we will use it as a High threshold.
- Every green squares are received datapoints.
We will progressively add more information to describe the different features.
Alert types
Raw alerts
In this mode, Datahub will validate the value of every datapoint against the threshold.
Use case:

In this example, 3 alerts will be raised as we have 3 datapoints above the threshold.
Rolling alerts
In this mode, for each datapoint, Datahub will validate the aggregated value of a specified period preceding and including the datapoint.
The period specifies how far in the past Datahub should fetch the data (1H, 3 days, 4 weeks, ...). As the alert checks on a single value, you need to specify how Datahub will aggregate the data. You can choose your aggregation from the following list:
- SUM: returns the sum of the value of all the datapoints in the period
- MIN: returns the minimum value of all the values of the datapoints in the period
- MAX: returns the maximum value of all the values of the datapoints in the period
- AVG: returns the averaged value of all the values of the datapoints in the period
- COUNT: returns the number of datapoints in the period
- VAR: returns the variance of the values of all the datapoints in the period
- STDEV: returns the standard deviation of the values of all the datapoints in the period
Warning
The aggregation VAR and STDEV can't be used together with schedules or exceptions. The calculations won't be correct as data will be missing due to the schedules or the exceptions.
Use case 1
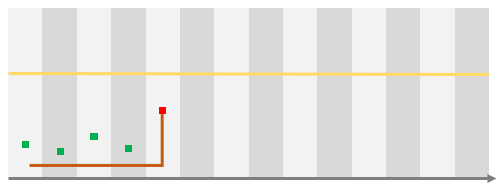
Here we will assume that we just received the red datapoint and that this rolling alert is configured to check on the last 4 periods with a MAX aggregation.
In this case, the alert is not raised as no datapoint is above the threshold.
Use case 2
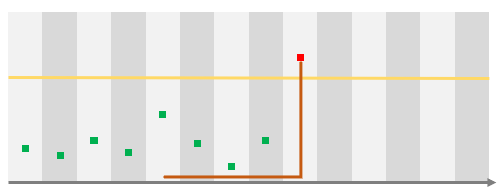
Here, considering the same alert configuration as for the Use case 1, the alert will be raised as the last ingested datapoint is above the threshold.
Use case 3
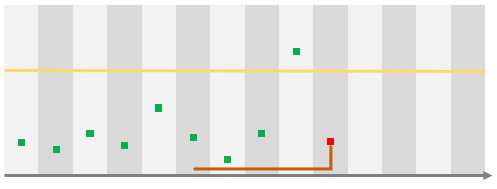
If we go further in time to the next datapoint, in this case the alert will still be raised even if the last datapoint (in red) is below the threshold as there is one datapoint in the period that is above the threshold.
Scheduled alerts
In this mode, Datahub will validate the aggregated value of a specified period at a specified time.
In other words, this type is identical as rolling but is not triggered by the ingestion of a datapoint but on a fixed schedule.
Warning
The aggregation VAR and STDEV can't be used together with schedules or exceptions. The calculations won't be correct as data will be missing due to the schedules or the exceptions.
Use case:
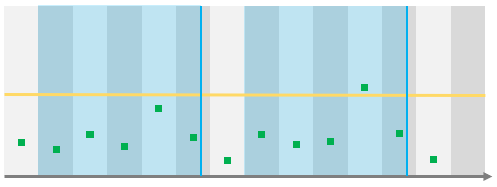
In this example, the alert is configured to check on the last 4 periods with a MAX aggregation. The vertical blue line represent scheduling of the alert and the transparent blue band represent the configured period.
This schema shows 2 times where the alert will be triggered.
On the first one, the alert will not be raised as no datapoint is above the threshold.
On the second one, we have a datapoint above the threshold, which means that the alert will be raised.
Note
As you can see, some datapoints are not included in any checks. This is a perfectly valid configuration. You can of course define a different granularity period, longer for example (e.g. 1 day) or having more frequent checks.
Note
Known issue here, if there is no data in the range and the alert defined has a 'low' threshold, some aggregation will faultly return 0. Should be addressed in a further release.
Notifications
Notifications allow you to received different types of messages when an alert is triggered.
Tip
Learn more about Notifications
Exceptions
Exceptions allow you to configure a period where you want to "desactivate" the alert.
Tip
Learn more about Exceptions
Schedules
The integration of the schedules in the alerts are a way to exclude datapoints based on a time factor.
Tip
Learn more about add a schedule to an alert
History
The history tab of the alert modal allows you to see all of the occurrences when the alert was raised.
Each history item has a state that can be one of the following:
- New
- InProgress
- Closed
Datahub does not currently use those states, they are there for your convenience so you can flag the occurrences for your own management.
The only usage of this field is in the number displayed on each row in the alert table.
Tip
It's time to create your first alert
