
Dashboards overview
The dashboards are the data visualization tools of Opinum.
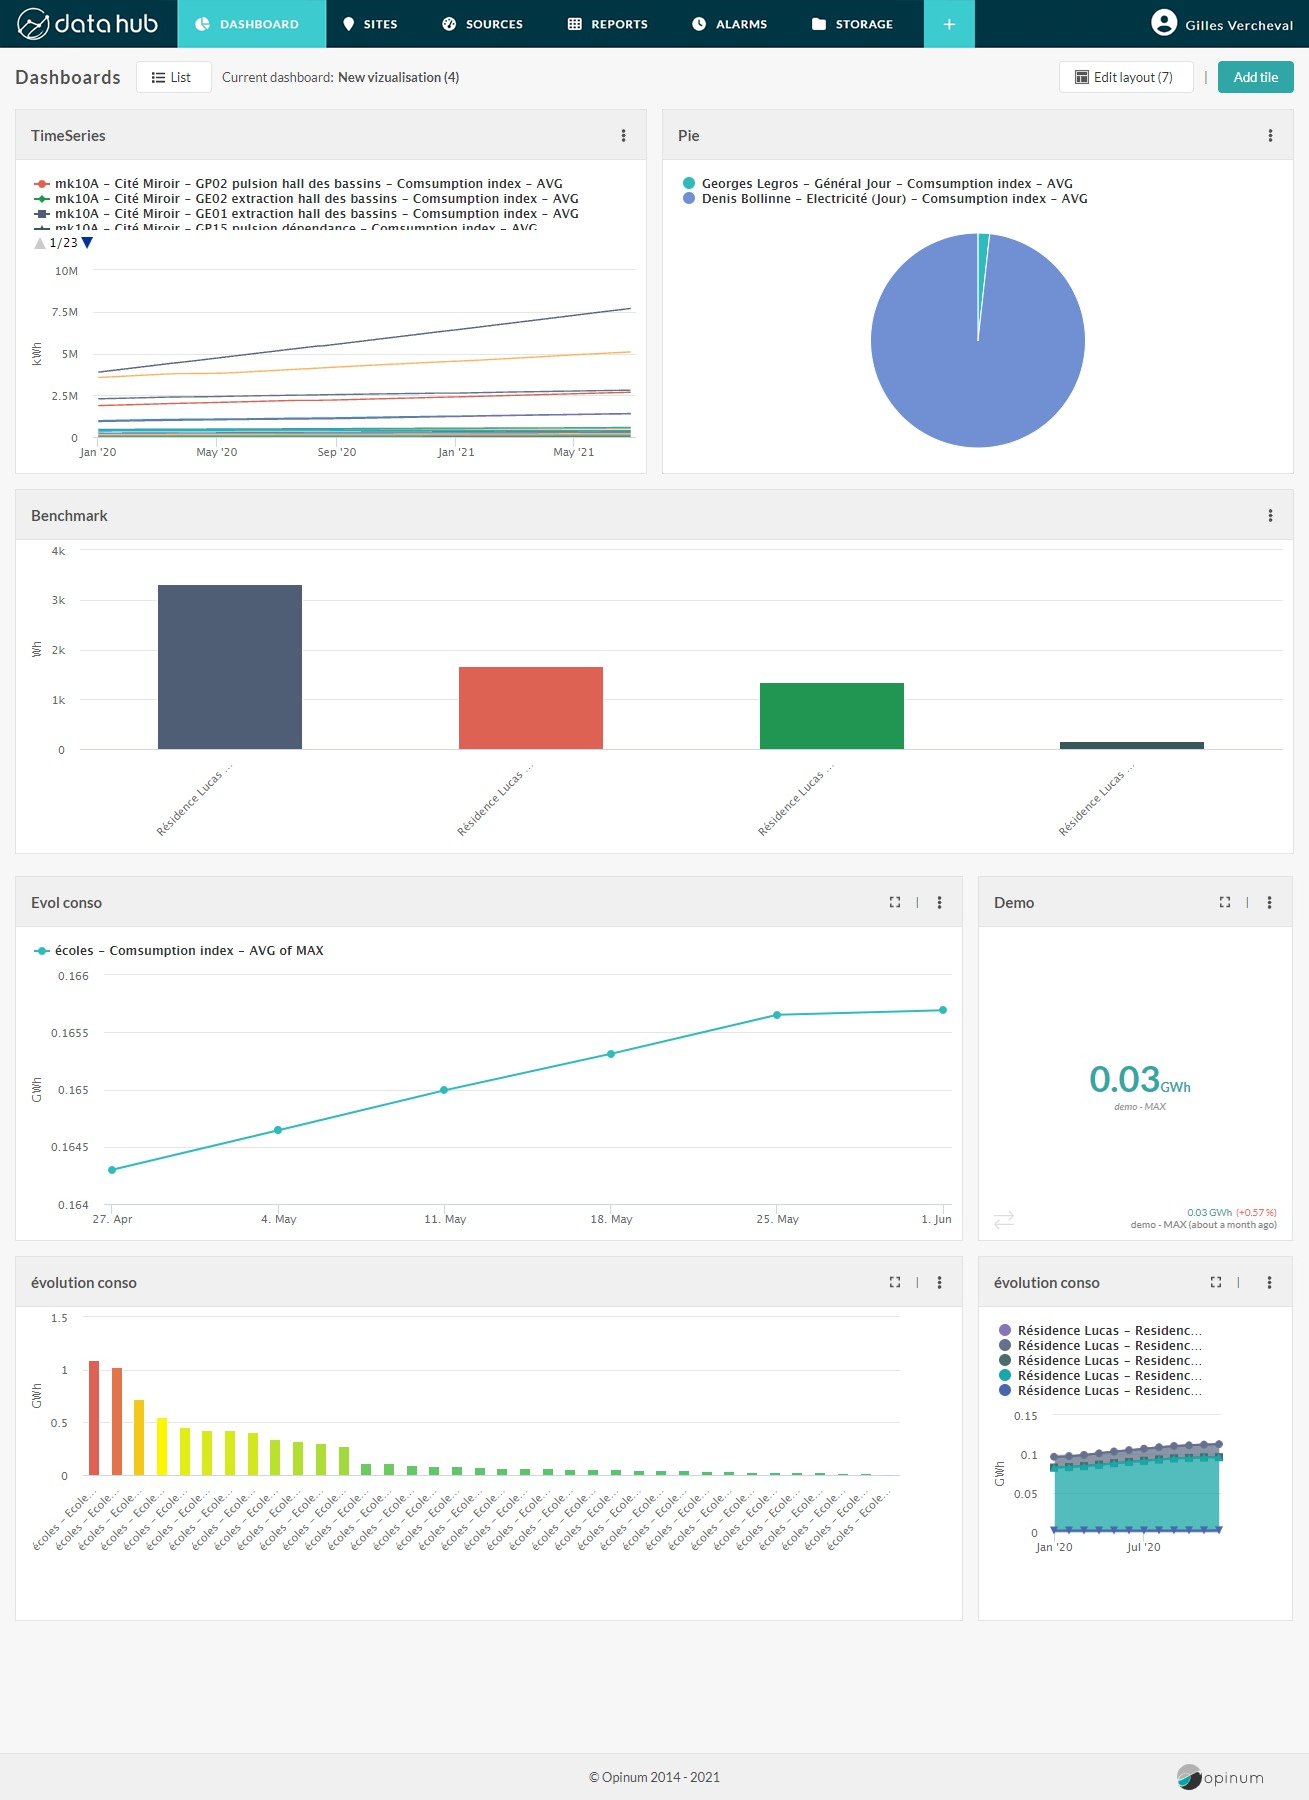
Create dashboards:
Each dashboard can be freely composed by different types of graphics available in Opinum Data Hub. You can choose to create a graphic based on the data uploaded in Opinum or based on external data.
Graphics based on Opinum datapoints:
- Pie chart
- Timeseries
- Benchmark
- Heatmap
- Value
- Correlation
- Maps
- Geozone map
For each graphic you will need to choose the time frame and the data of your data sources. You will be able to choose the variables, aggregations and units.
Graphics based on GPS coordinates:
- Map
Graphics based on Opinum alarms:
- Maps
- Timeseries
- Benchmarch
Graphic based on external data:
- Power BI
- External web site
- Image
- Free text
When your dashboard is ready you can manage and share it:
- Share a dashboard to some users only: give read, write or admin access to some users in Opinum Data Hub
- Share a dashboard within the account: give access to the dashboard to all users of the account
- Share the dashboard externally: create a custom link to the dashboard available for any people who have this link.