Create a template with the advanced helper
Reports can now be exported in custom format (CSV, JSON or XML). The advanced helper assists you to create the body of your custom template using the Scriban language.
The managers can find the Template page in the Settings section of Datahub :
When clicking on the 'Add Template' button, a pop-up 'New Template' opens. The advanced helper is displayed just below the body, with the following tabs :
- Data
- Sites
- Sources
- Variables
- Alerts
- Events
- Invoices
- Schedules
To select a tab and display the related properties, you just need to click on it.
Data Tab
The data tab allows you to choose which information (properties), related to your datapoints, will be displayed in the report.
Add the datasources
In a report, you can define one or more datasources (Learn more about reports creation). The configuration of these datasources defines which data will be retrieved.
E.G :
When running the report, the datasource named 'myDataSource' will retrieve all the data for the variable 'general consumption' of the source 'Source 1 - Electricity' for the last year and the current year. These data will be aggregated (sum) by Month.
You can display these data in a custom report by adding a new 'while' loop in the template's body. To do this, use the first line in the advanced helper. Insert the name of the datasource in the second field (right after the 'in') and click on 'Add'.
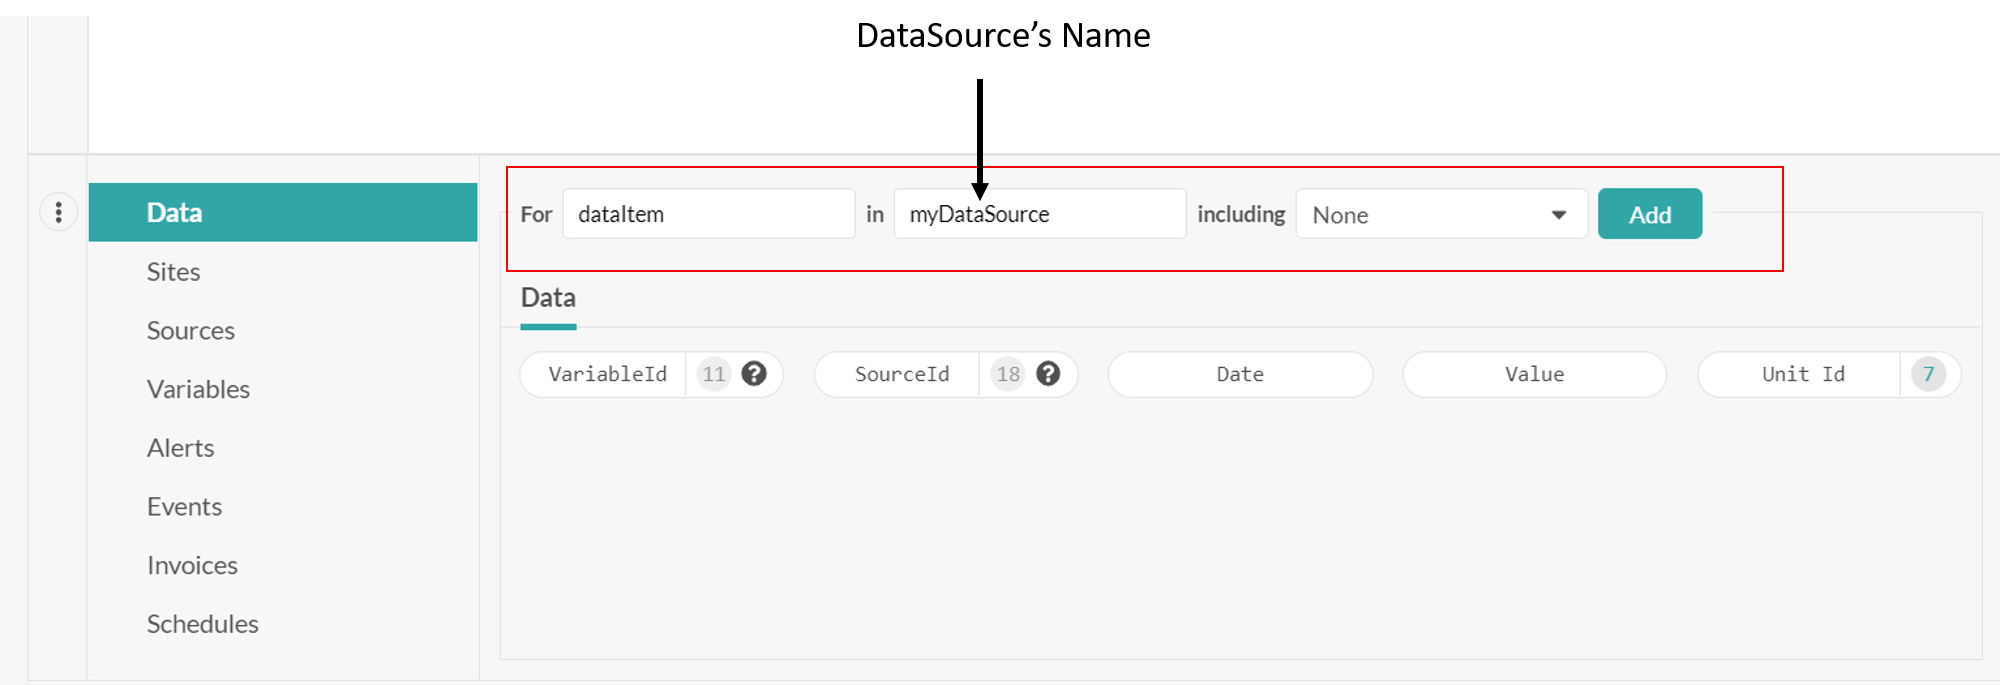
Don't worry about the 'dataItem' in the 'for' field. It will not appear in your report and just allows the system to iterate on each datapoint contained in the datasource.
Now, you can add the properties you want to include in the report for every datapoint in the datasource.
Select the information to display for each datapoint
For each datapoint, you can display the following properties :
- VariableId
- SourceId
- Date
- Value
- UnitId
You can see them displayed in the advanced helper. Put your cursor in the right place (into the loop, between the while and the end) and select the properties from the helper.
You can add some layout by, for example, writing a header for each property :
When running the report, if there are 3 datapoints for the datasource, this template will output a file looking like this :
Some of the properties in the advanced helper are followed by a number. This means that there are other linked properties that you can select.
For example, the '7' next to 'Unit Id' indicates that there are seven additional properties that you can use.
Several DataSources in a report
If the report contains more than one datasource, you will have to define a new 'while' loop for each of them.
E.G : if my report contains 3 datasources and I want to display the datapoints' information for each one, I need to add three while loops to my template :
N.B : A single loop can iterate over multiple datasources with the same name.
Including Variable, Source and Site information
It is possible to display variable, source and site information linked to the datapoints contained in the datasource.
Next to properties 'SourceId' and 'VariableId', you can see a number indicating that other properties can be selected. These are only active if you select 'including Sources an sites' or 'including Variables, sources and sites' in the while loop :
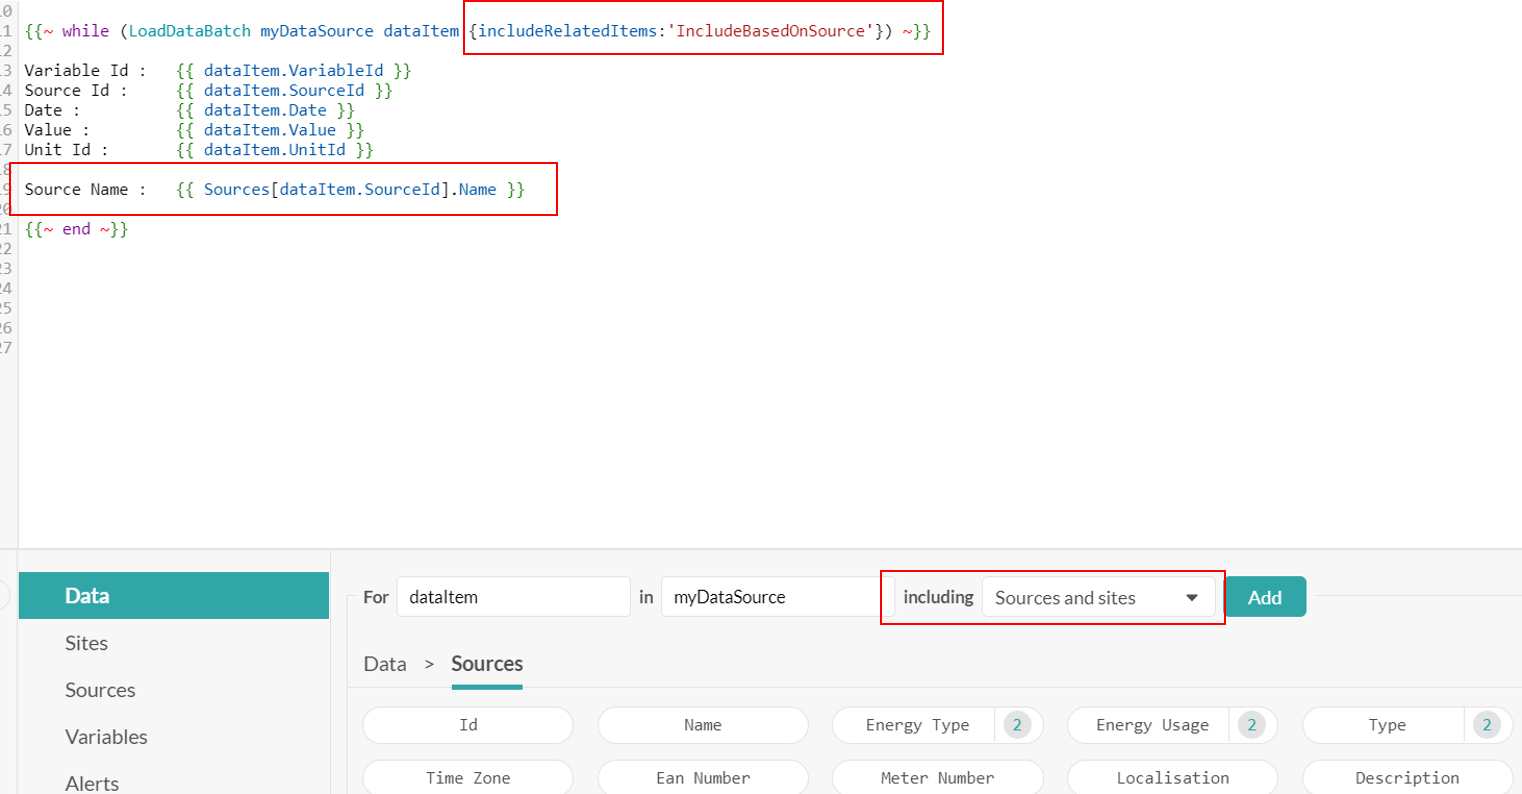
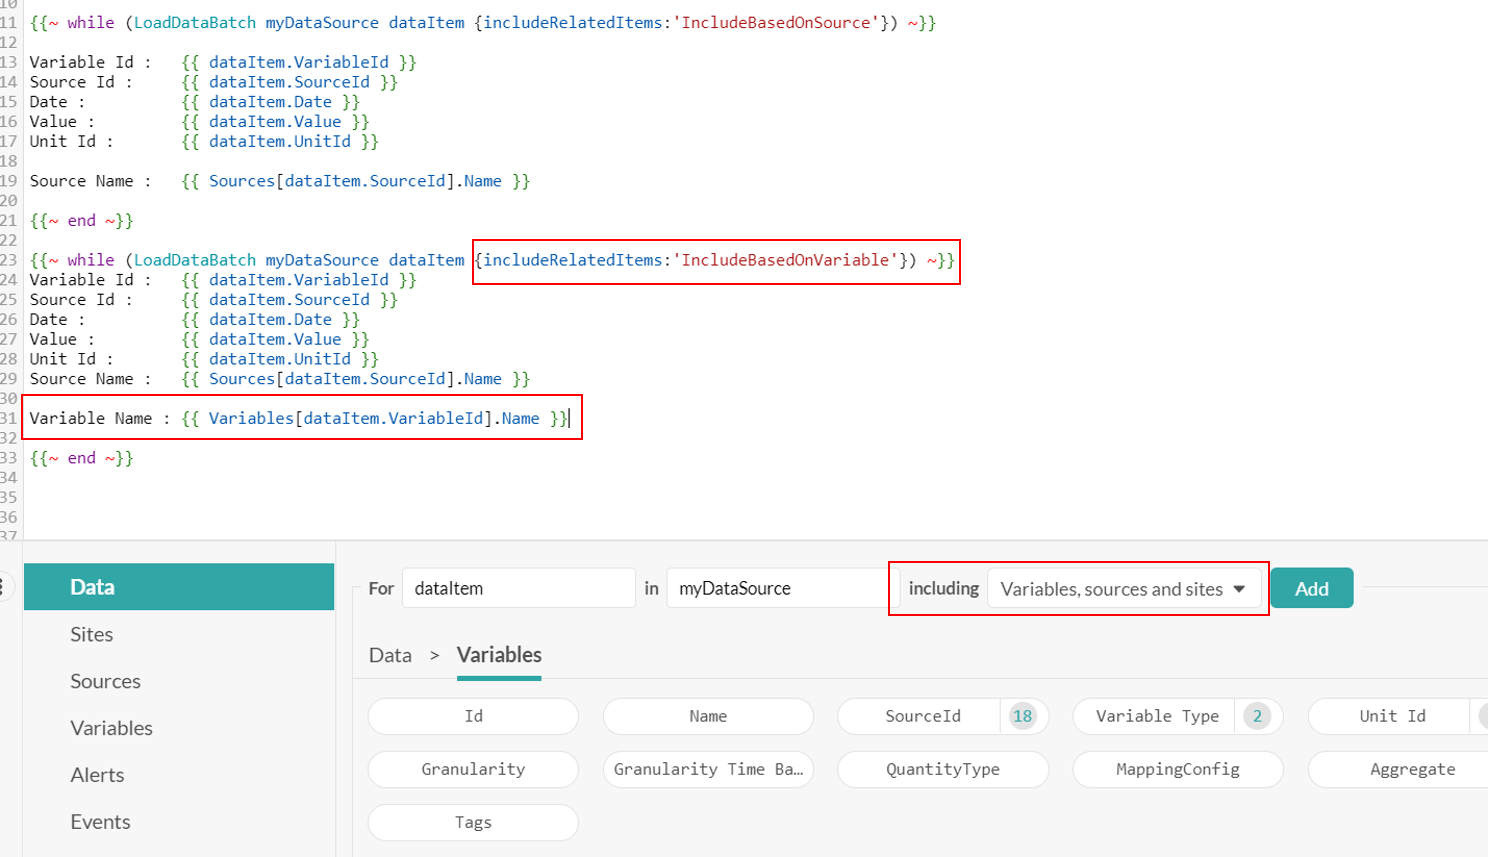
Including 'Sources and sites' will enable additional linked properties for Source and Site, while 'Variables, sources and sites' enables all linked properties (variables, sources and sites) from the data tab.
Metadata Tabs
Below the Data tab, the metadata tabs are available:
- Sites
- Sources
- Variables
- Alerts
- Events
- Invoices
- Schedules
In order to display metadata related to the datasources, these metadata must be enabled in the report.
E.G. : This report has only Sites and Sources enabled. If you use a template calling for Variables metadata, the report won't work.
Add the metadata
Just like with the data, you need a while loop to iterate over the metadata you want to display.
To do this, you can again use the first line in the advanced helper. The name in the 'in' field must match with the name of the metadata in the report :
Then click the 'Add' button :
Select the information to display for each metadata
For each metadata, you have the list of the available properties in the advanced helper:
Make sure that the properties are correctly placed into the while loop :
Reference Report
Datahub lets you choose a reference report for your template.
Once a reference report is selected, its content will be reflected in the advanced helper. The name of the datasources are prefilled and only the tabs of the metadata enabled in the report will be displayed.
E.G. :
My report contains 3 datasources and has 3 metadata enabled :
When selecting it as a reference report in my template, the 3 datasource names are available in a drop down in the data tab. The names of the metadata have also been prefilled.
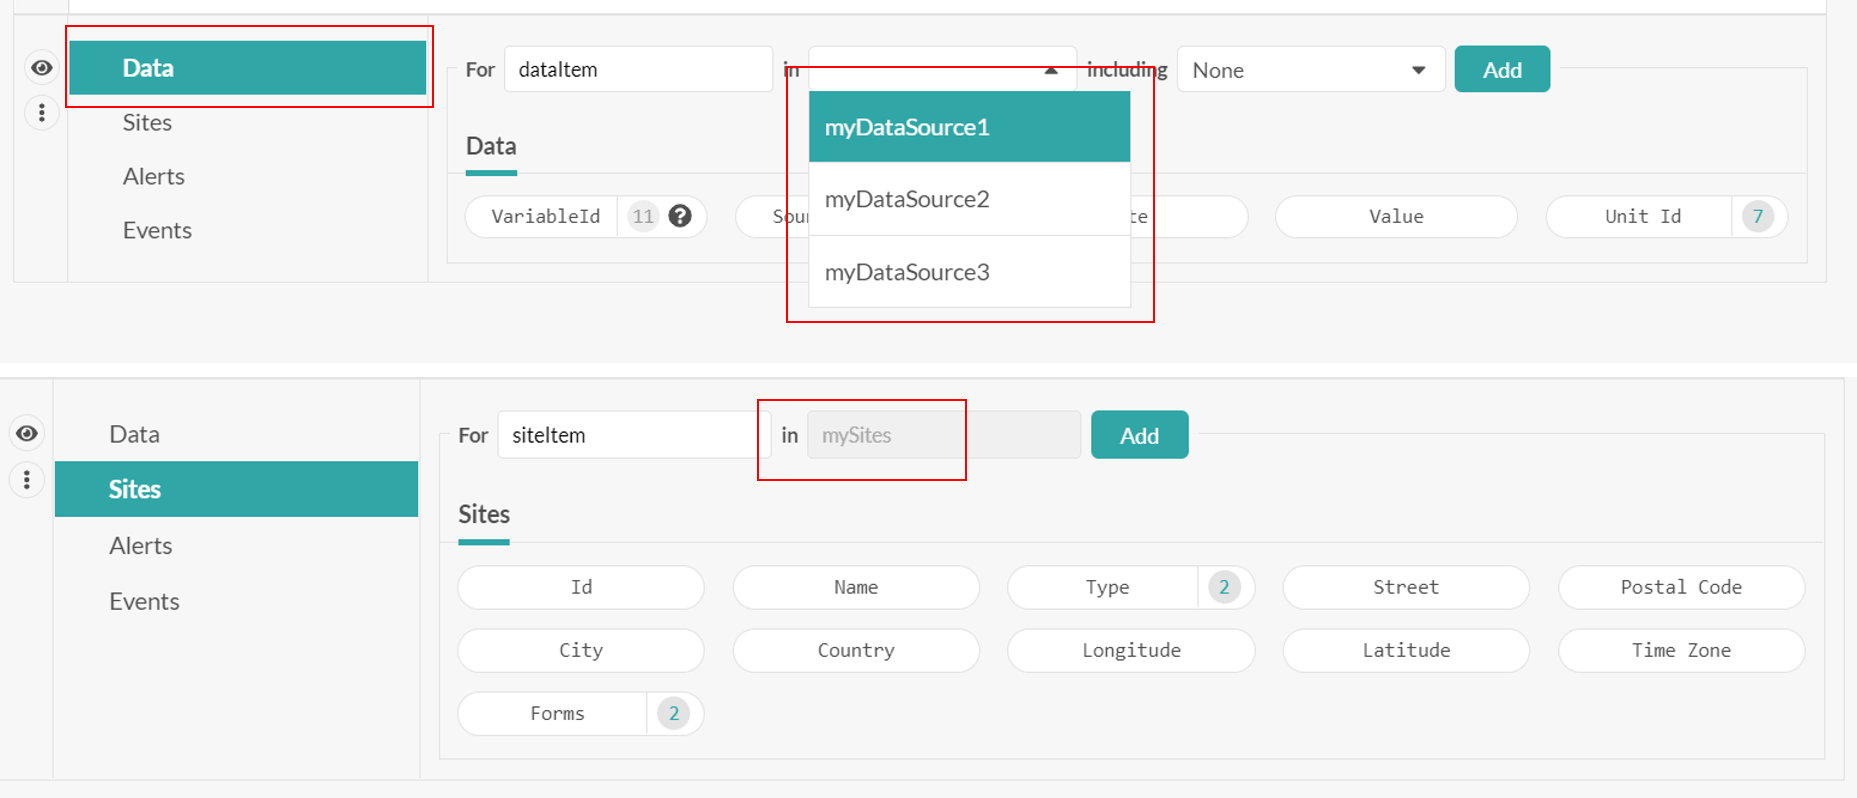
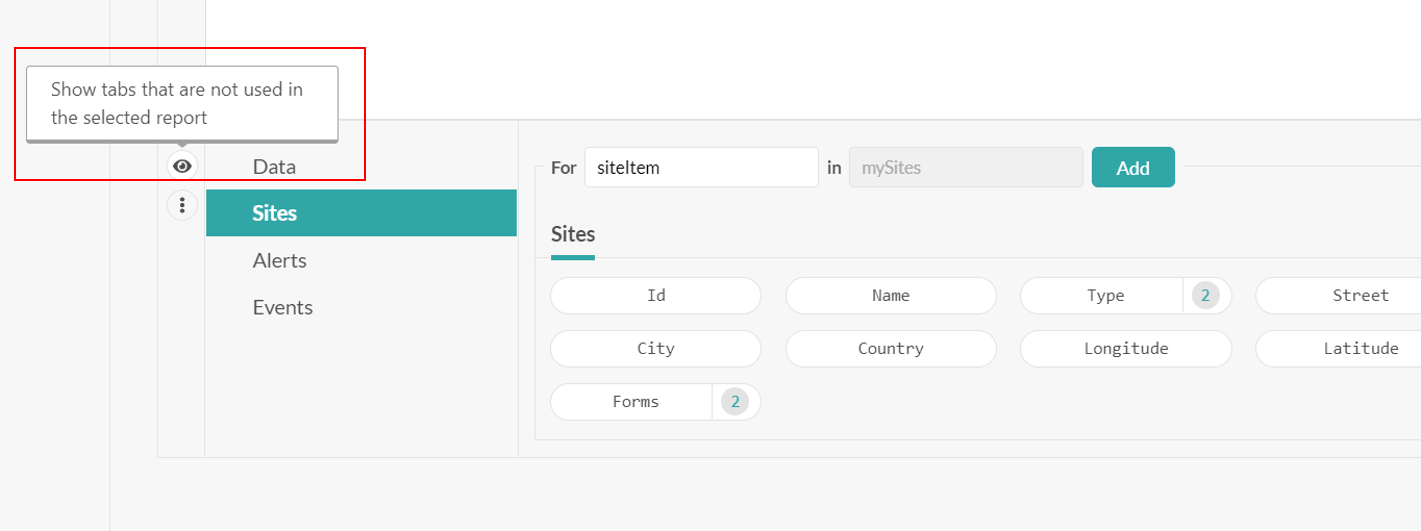
You can always display the other metadata tabs by clicking on the 'eye' icon :
Resources
Tip
If you want to go even further in leveraging the Scriban library in your custom templates, you can find more technical documentation in this section.
