
Usage page
The usage page allows customers to track the KPIs of their Data Hub account.
Page display
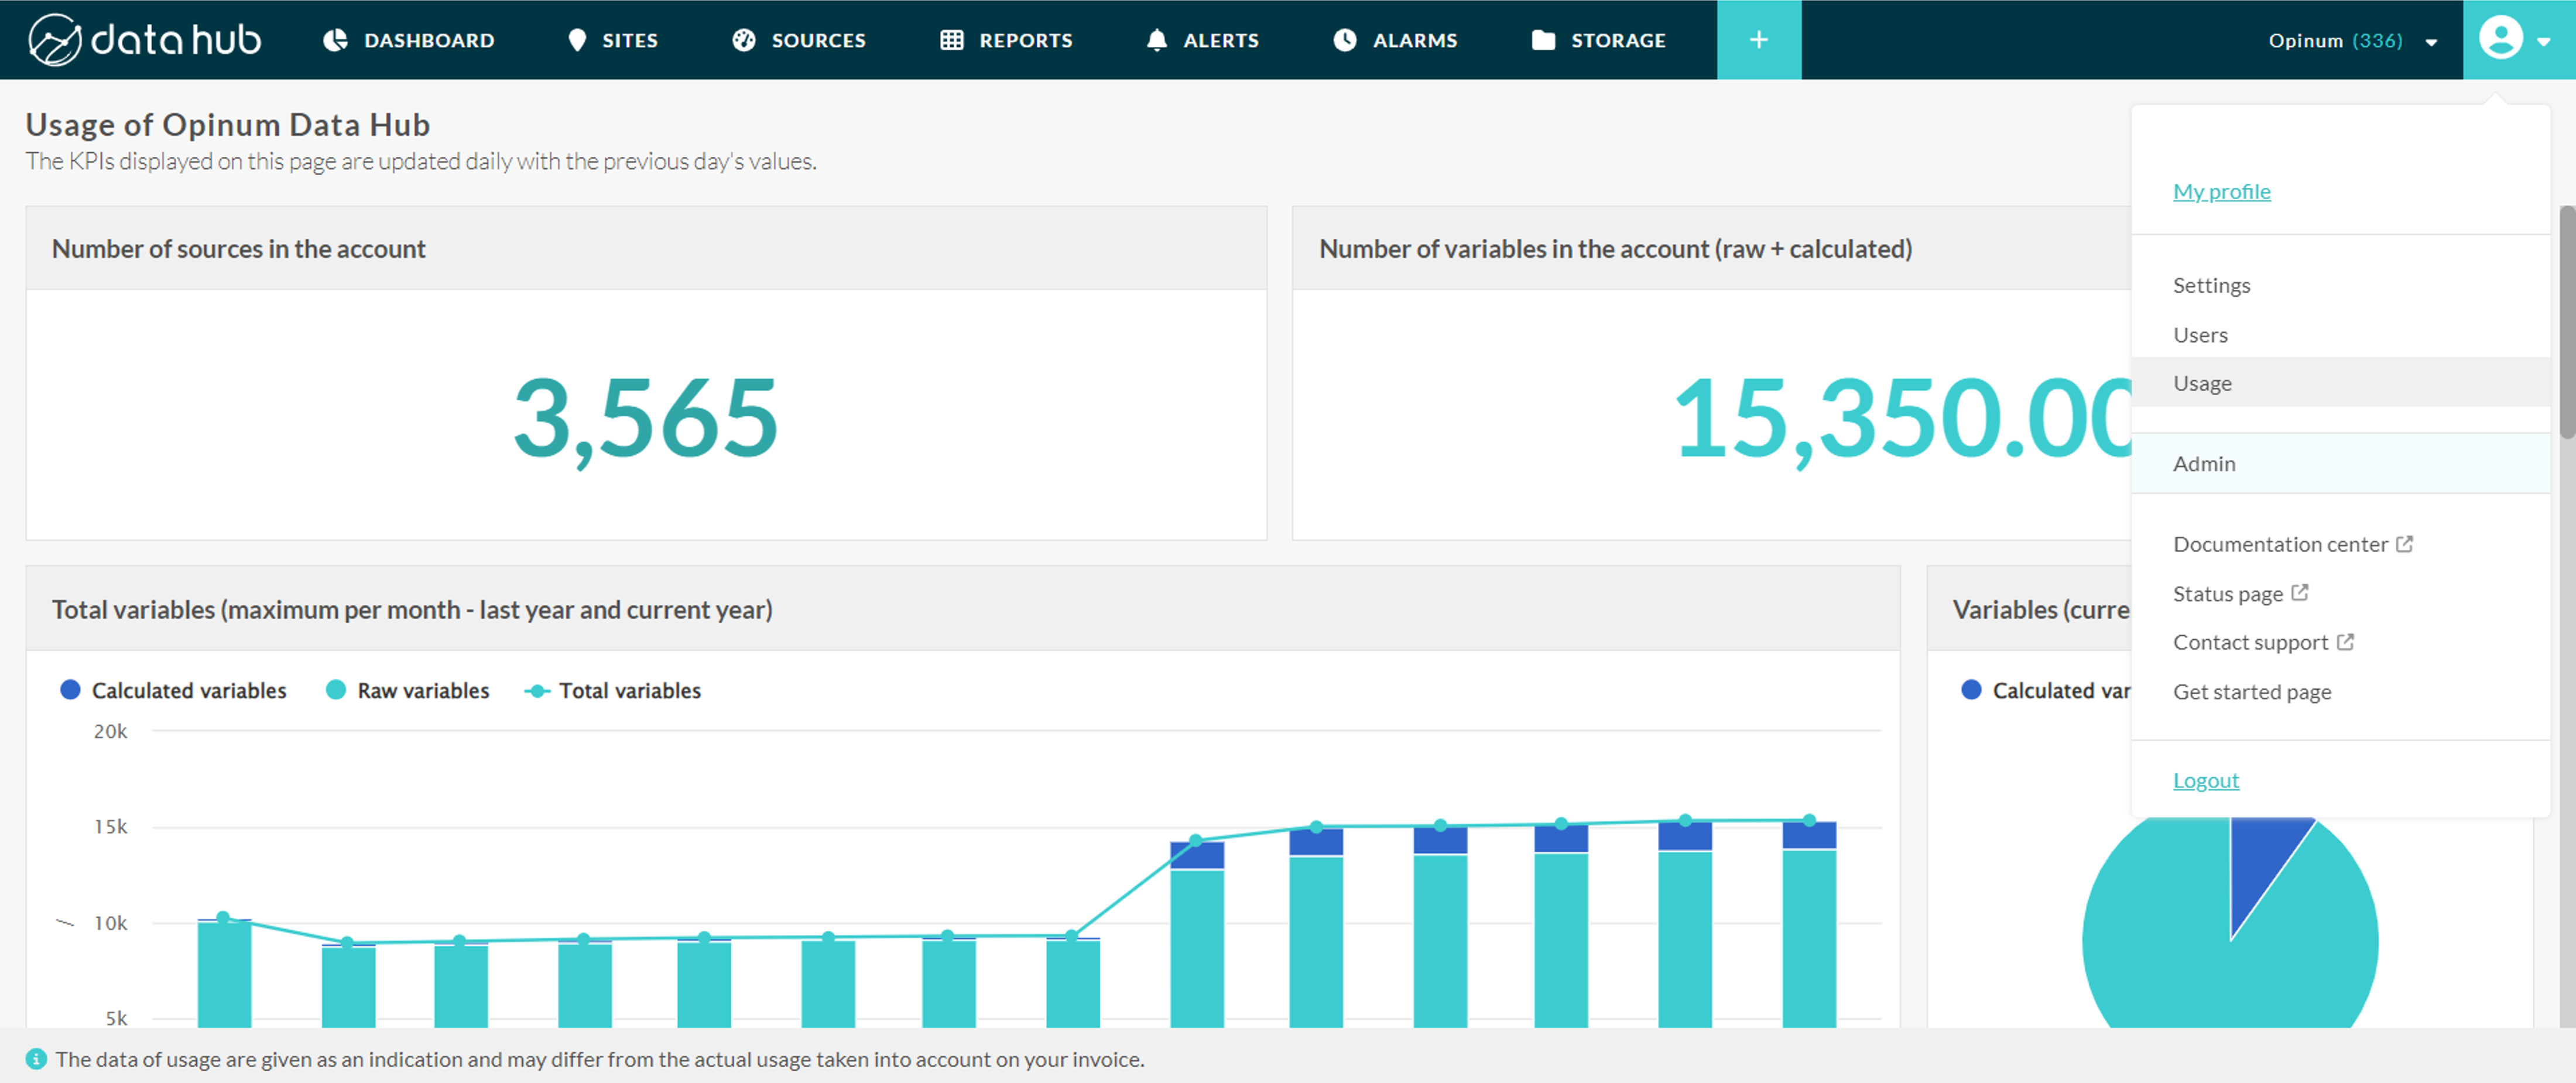
The usage page allows to track KPIs of Data Hub usage that are likely to have an impact on billing. The data of usage are given as an indication and may differ from the actual usage taken into account on your invoice. This feature is reserved for users with manager role.
The page is available in the Account menu or directly at https://datahub.opinum.com/usage.
The Usage page is available in all accounts since release 6.0 in February 2024.
Page content
The KPIs displayed on this page are updated daily with the previous day's values. When available the last year is displayed with the current year.
Each time serie can be clicked to display the lower granularity, down to the day.
Sources
This graphic displays the number of sources stored in the account live.
Variables
Note
For the moment, variables from shared external data sources are not counted in this Usage page. They may be in the futur.
Number of variables in the account: this graphic displays the total number of variables stored in the account as of the previous day, including both raw and calculated variables.
Total variables (maximum per month - last year and current year): this graph shows the evolution of the number of variables (simple and calculated variables) per month. If your data from last years is available, it will be displayed alongside the current year. For each bar, the maximum number of variables is displayed.
Variables (current month): this graph shows the distribution of variables between simple and calculated variables, for the current month.
Note
As usage is always calculated for the previous day, this graph is emptied every 1st of the month.
Datapoints stored
A datapoint represents a numerical value at a specific moment in time, therfore it is represented by a pair (Time, Value), stored in variables.
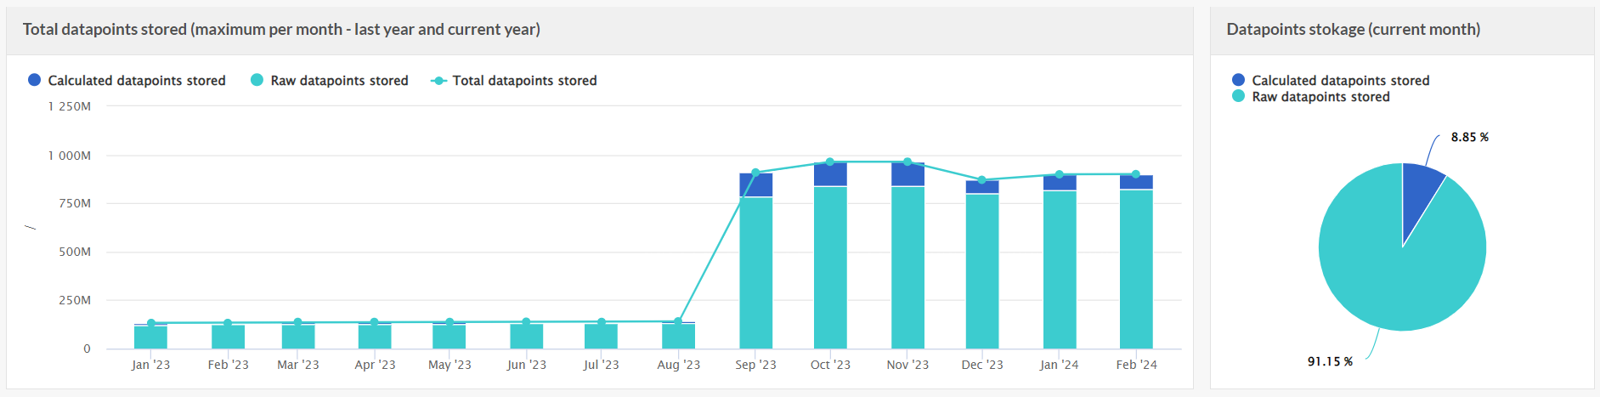
Total datapoints stored (maximum per month - last year and current year): this graph shows the evolution of the maximum number of datapoints stored in our database per month.If your data from last years is available, it will be displayed alongside the current year.
The graph shows the datapoints stored in raw data and the datapoints resulting from the calculation of the calculated variables.Datapoints storage (current month): this graph shows the distribution of datapoints stored between raw datapoints and datapoints resulting from the calculation of the calculated variables, for the current month.
Note
As usage is always calculated for the previous day, this graph is emptied every 1st of the month.
Tip
Learn more about stored datapoints limitations.
Datapoints written
A datapoint can be written -uploaded- in our database by the ingestion of a raw data or by the calculation of a calculated variables. We are counting all writting operations, even if the same datapoint is overwritten.
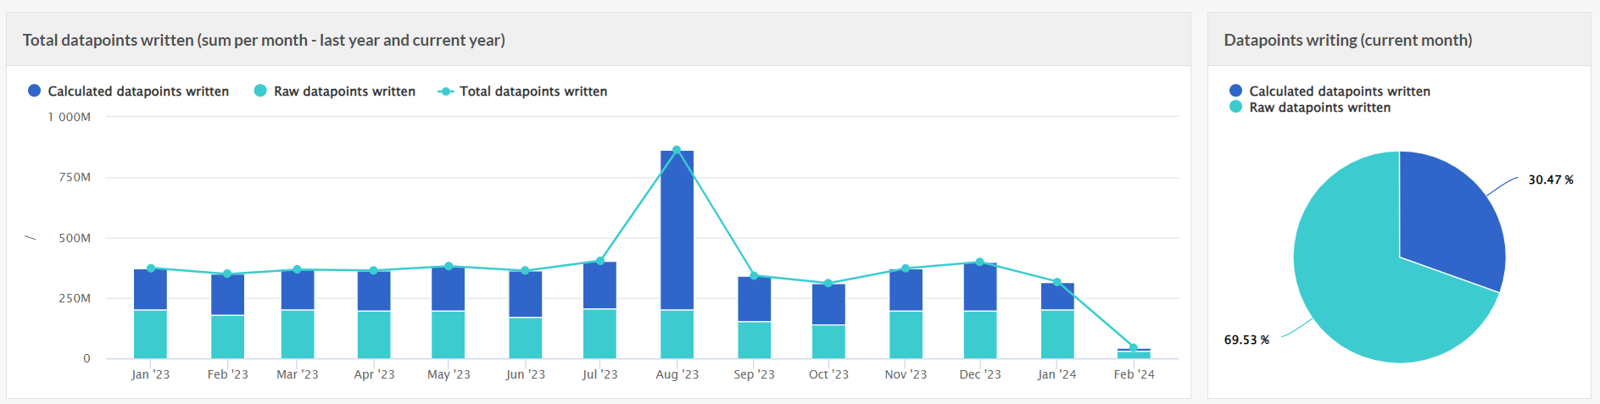
Total datapoints written (sum per month - last year and current year): this graph shows the evolution of the maximum number of datapoints written in our database per month. If your data from last years is available, it will be displayed alongside the current year.
The graph shows the datapoints written as raw data and the datapoints resulting from the calculation of the calculated variables. If datapoints are re-ingested and if calculated variables are re-calculated this will be reported in this graph.Datapoints writting (current month): this graph shows the distribution of datapoints written between datapoints written in raw data and datapoints resulting from the calculation of the calculated variables, for the current month.
Note
As usage is always calculated for the previous day, this graph is emptied every 1st of the month.
Tip
Learn more about written datapoints limitations.
Datapoints read
Datapoints are read through the GetData in the API, but also when creating and viewing dashboards and reports.
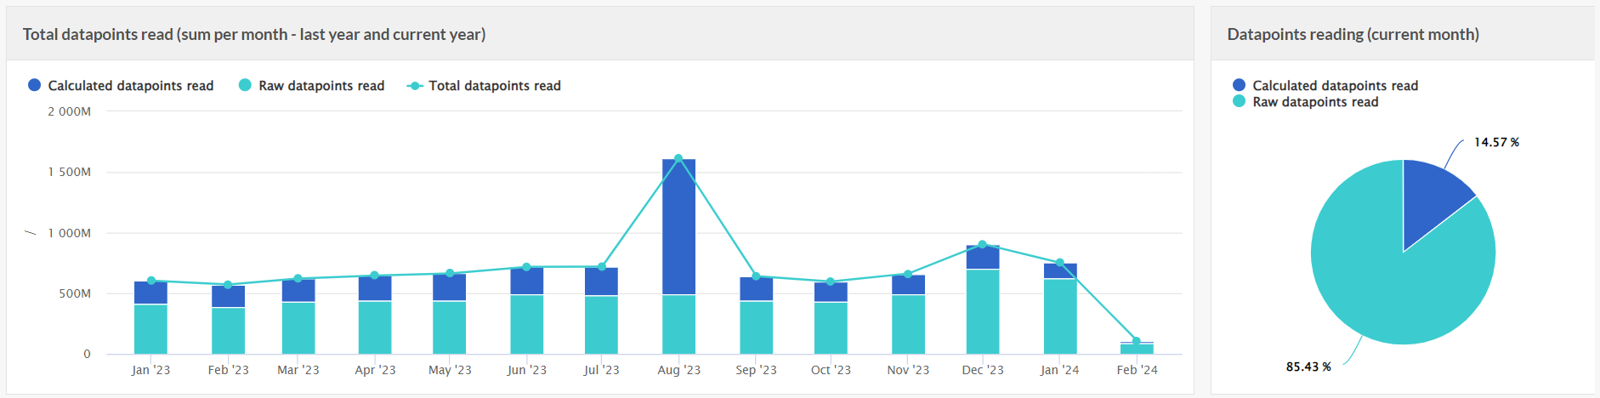
Total datapoints read (sum per month - last year and current year): this graph shows the evolution of the sum of datapoints read in our database per month. If your data from last years is available, it will be displayed alongside the current year.
The graph shows the reading of raw data and the datapoints resulting from the calculation of the calculated variables.Datapoints reading (current month): this graph shows the distribution of datapoints read between raw data and datapoints resulting from the calculation of the calculated variables, for the current month.
Note
As usage is always calculated for the previous day, this graph is emptied every 1st of the month.