
Manage graphics
Once graphics are displayed in a dashboard they can be edited, shared and deleted from the actions bar displayed in the header of each graphic.
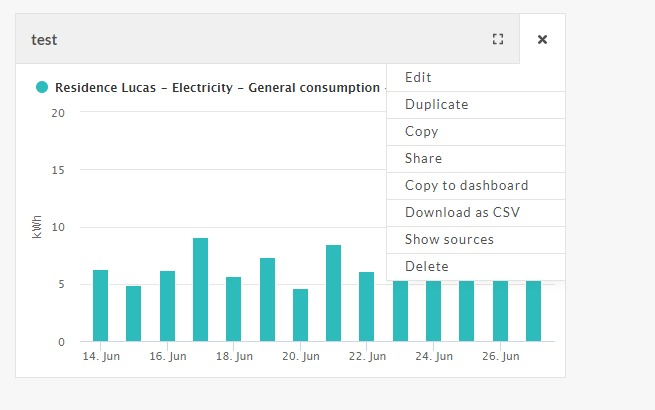
Change size
To change the size of your graphic, click on the icon of the new size in the header of the graphic.
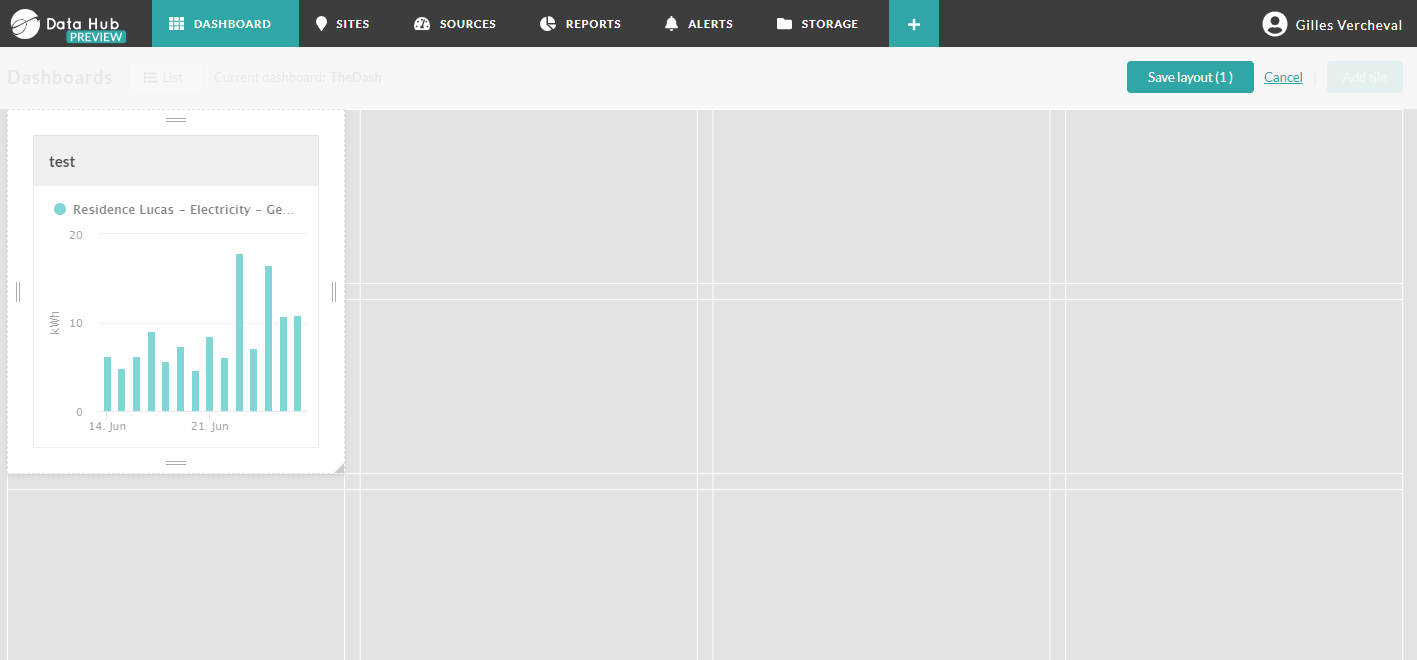
Move graphic
To move your graphic in the dashboard, click on the cross icon in the header of the graphic, and move it in the dashboard.
Edit graphic
To edit a graphic, click on the pen icon in the header of the graphic. The graphic pop-up opens, edit want you need and click on thesave button.
Copy graphic
To copy a graphic, click on the copy icon in the header oft the graphic.
A confirmation pop-up appears. Click on the Copy button to save the graphic as an image to you clipboard. You can then paste it wherever you need to.
Share graphic
You can send a graphic by email. To share a graphic, click on the share icon displayed in the header of your graphic.
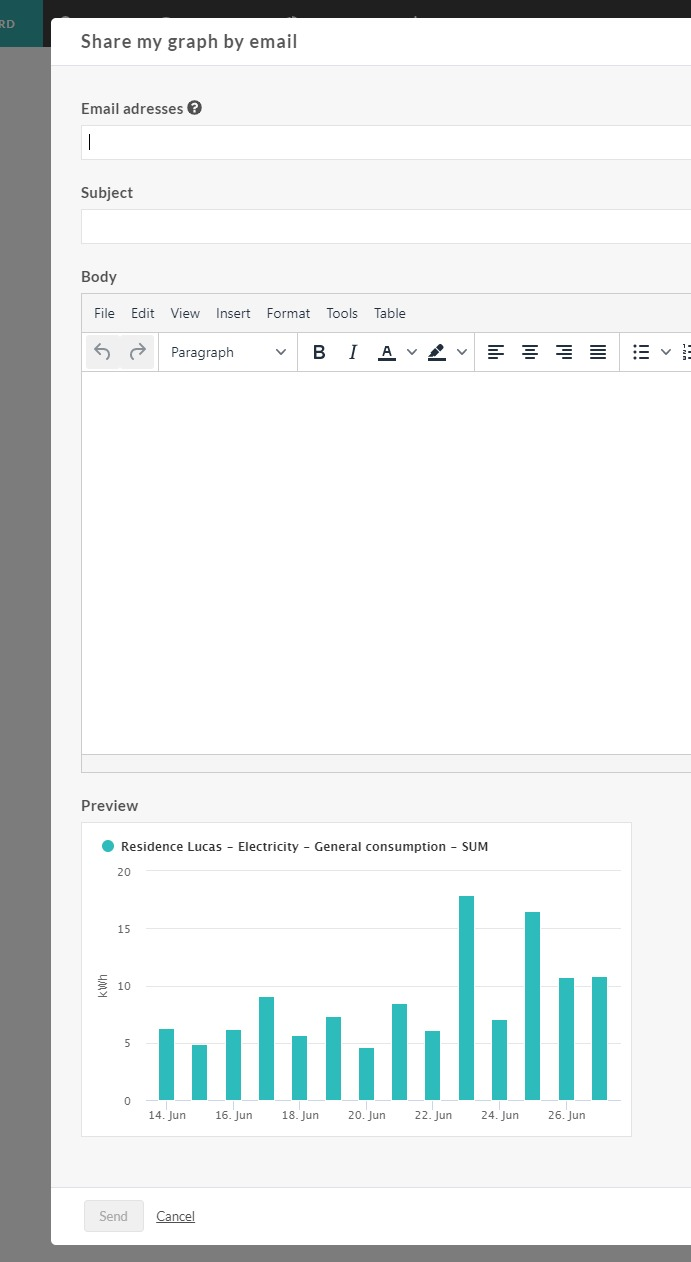
The share pop-up appears. Choose one or more address mail to send the graphic, enter a subject for the email and click on the Send button to send the image of your graphic by email.
Duplicate graphic
To duplicate the graphic click on the duplicate icon in the header of the graphic.
The same graphic is added at the end of the dashboard.
Download csv
The raw data of a graphic can be downloaded .csv file. To download the raw data of the graphic click on the download icon in the header of the graphic.
The download is stating automatically.
Delete Graphic
Warning
When a graphic is deleted, the data can't be retrieved.
To delete a graphic, click on the bin icon in the header of the graphic.
Linked meters
The sources used to create the graphic are available by clicking on the Linked meters li in the header of the graphic. The Sources page opens with the list of sources used in the graphic.