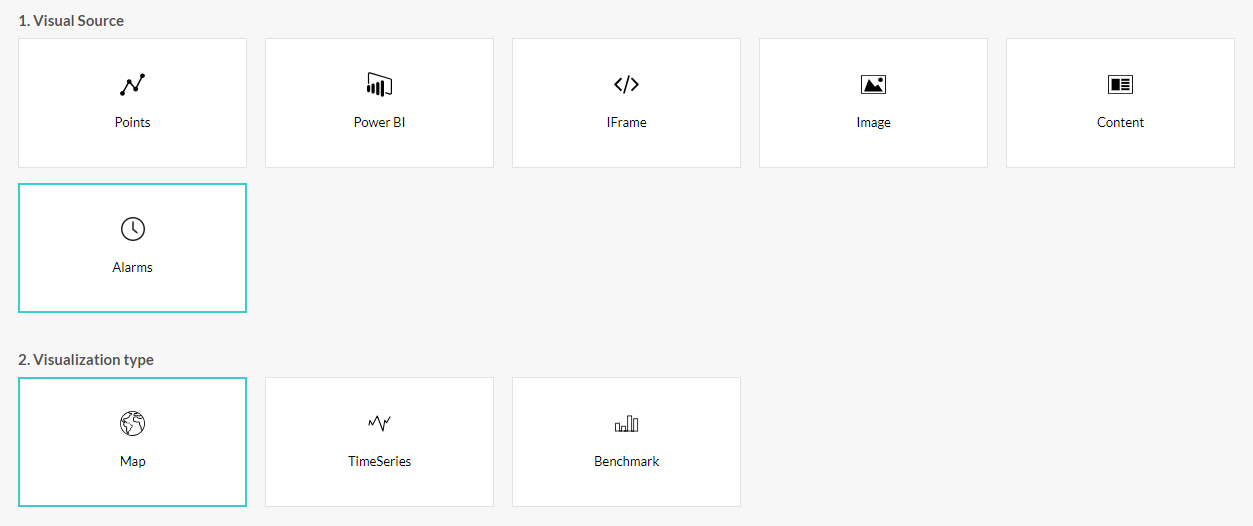
Alarms tiles
To create a graph based on Opinum alarms, select the Alarms visual source. Those graphs allow to visualize alarms current status or occurences, without adding any variables. The graph are directly connected to the alarms data base.
Types of graphics
Choose the type of graphics you want to create:
- Map (Alarm current status): graph displaying current alarm state on a map
- Time series (Alarm current status): graph showing alarm current state on a timeline
- Time series (Alarm history): graph showing alarm history on a timeline
- Benchmark (Alarm history): graph showing a comparison of alarms histories

Time frame
Exactly like for the points graphics, there are two types of time frame you can define for alarms graphs:
Absolute : allows you to define a precise date range by selecting it through the date picker.
Relative : allows you to select a rolling period that evolves over the time. Three options are available :
Past : Only complete past periods will be shown. For example, when selecting 'Relative - Past - 1 Week' the 22 June 2023, data from the week before the 22 June 2023 (12-06-23 to 18-06-2023) will be displayed.
Past and current : complete past period will be shown AND the period until the current day and hour. For example, when selecting 'Relative - Past & current - 1 month' the 22-06-2023 16:00:00, data from the 01-05-2023 00:00 to 22-06-2023 16:00 will be shown.
Current : only the current period will be shown. For example, when selecting 'Relative - Current - this year' the 22-06-2023 16:00:00, data from the 01-01-2023 00:00 to 22-06-2023 16:00 will be shown.
Note
Shift is not currently available for alarms.
Data
In this section, you can define the alarms that you want to visualize in the graph you are creating. You can choose your alarms in several ways:
- Alarms instances: unit alarm to be selected and added one by one
- Alarm template: select a template and all its instances will be added in the graphic
- Alarm view: select an alarm view and all its instances will be added in the graphic
- Alarm site view: select an alarm view cretae don a site page and all its instances will be added in the graphic
Alarms states
Select the alarm states you wish to display in the graphs, and their colour:
Maps: The colour of the marker will be that of the current alarm status. If several alarms are active on the same site, the colour of the marker will be that of the most recent alarm in the state chosen first in the list of states.
Timeseries: You can choose a color and a display option by state (cluster, stacked columns, stacked area, line, scatter)
Benchmark : Only one status can be selected. A gradient colors (2 or 3 ranges) can be defined.
Click on the Save button to see the new graph in the dashboard.
Tip
Learn more about Alarms
